Tabby Server Health Plugin
- Year
- 2026
- Role
- Personal project
- Status
- internal
A terminal panel showing CPU, memory load and uptime, so checking a server's state does not mean interrupting whatever is already on screen.
- TypeScript
- Tabby
- Linux
Problem
Checking whether a server is healthy usually means running top, reading it, and quitting out — which takes over the terminal you were already working in. Doing that repeatedly while watching a machine under load is a small, constant interruption.
Approach
A Tabby plugin that polls top every few seconds and surfaces the parts worth glancing at: CPU, memory load and uptime.
Deliberately a reader rather than an agent. It shells out to a tool that is already on every machine, so there is nothing to install on the servers being watched and nothing new to keep patched.
Written in TypeScript, for my own use.
Outcome
Personal tooling, used day to day. The pairing with the SFTP plugin is not an accident — once you have written one Tabby plugin, the terminal becomes a reasonable place to put small tools that would otherwise be another window.
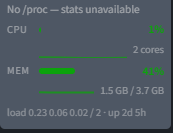
The collapsed widget showing CPU, memory and load average at a glance 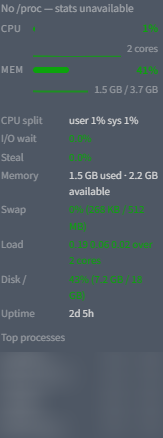
The expanded panel adding CPU split, I/O wait, steal, swap, disk and uptime